



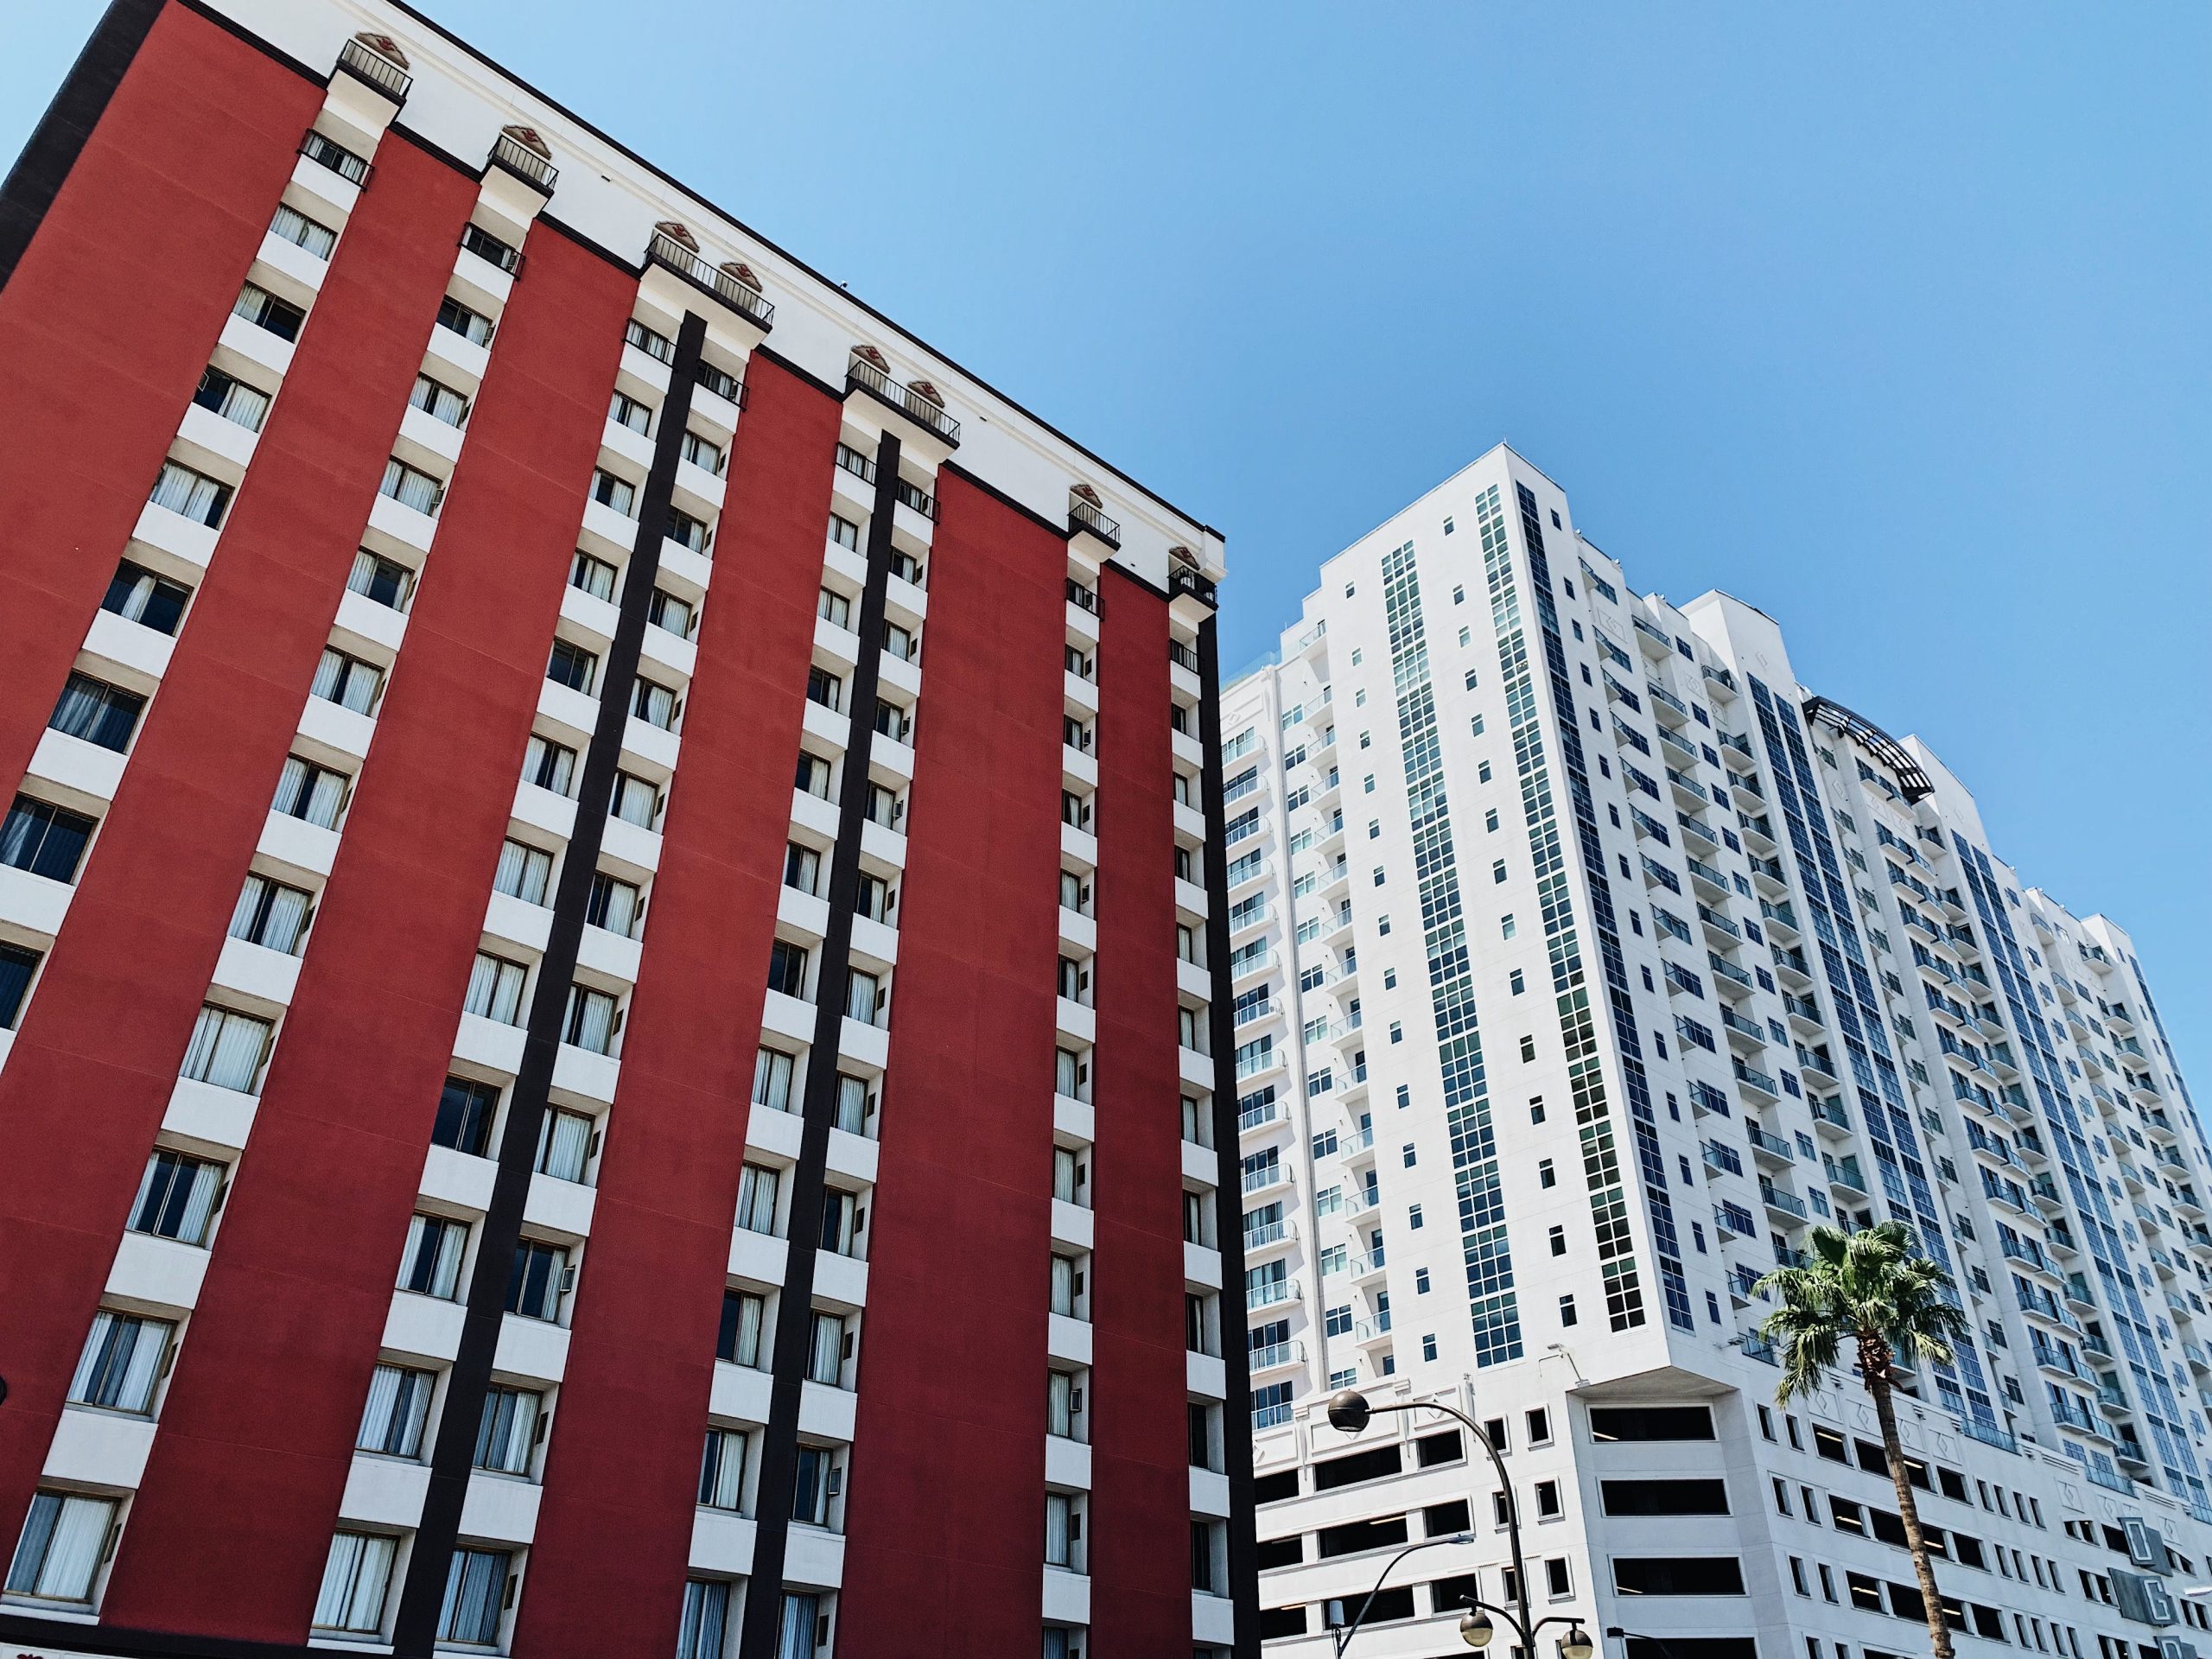
The median price of a single-family home in Las Vegas was $470,000 in September 2026. That is down from the all-time high of $490,000 set in May and June. It is roughly flat compared to a year ago. And it is being achieved in a market where single-family sales fell 7.4 percent year over year, condo and townhome sales fell 12.6 percent, and the total transaction value of the residential market dropped 10.3 percent in the twelve months ending in September.
Prices are holding near their peak while volume collapses. That is the Las Vegas housing market in the fall of 2026.
The Interest Rate Problem That Nobody Can Predict
The 30-year fixed mortgage rate was 7.32 percent on October 22, according to Freddie Mac’s national benchmark. That is not a promotional rate, a buydown, or what any specific buyer will actually be offered. It is the national reference point, and in Las Vegas it is creating a monthly payment calculation that removes a significant portion of the buyer pool from consideration on homes priced near the median.
Las Vegas Realtors president noted in the September data release that rising mortgage rates are playing a “bigger role in the housing market.” The NAR’s chief economist, pressed on where rates go from here, said no one knows.
That is not a hedged answer designed to protect a forecast. It is an accurate description of the situation. The rate trajectory depends on Federal Reserve policy decisions that are themselves contingent on inflation data, labor market conditions, and global factors that have resisted clean prediction for two consecutive years. What is knowable is the payment math at current rates. A $470,000 home at 20 percent down leaves a $376,000 loan. At 7.32 percent, the principal and interest payment is approximately $2,593 per month, before property taxes, insurance, and HOA costs. In Clark County, where assessment increases on primary residences are capped at 3 percent annually, the tax component is predictable once established. The insurance component has been rising.
For first-time buyers without equity from a previous home sale, the monthly payment at current rates represents a meaningful barrier. For move-up buyers, the same rate that makes the new home expensive also applies to the home they are trying to sell, locking them into their current mortgage rather than triggering the kind of inventory release that would normally follow a period of price appreciation.
What the Inventory Numbers Actually Say
Las Vegas Realtors reported 7,995 single-family homes listed without offers as of the September data, up 6.6 percent year over year. Condos and townhomes without offers numbered 2,796, up 7.3 percent. Supply sits at approximately five months, up from roughly four months a year earlier.
Five months of supply is generally considered the boundary between a buyer’s market and a seller’s market. Below five months traditionally favors sellers; above five months traditionally favors buyers. Las Vegas is sitting on that line, which is exactly what the price data shows: prices are not collapsing because supply is not dramatically elevated, but they are not accelerating because demand has been meaningfully reduced by rates.
The speed of sale numbers are counterintuitive in this environment. 75.9 percent of single-family homes that did sell moved within 60 days, up from 72 percent a year ago. For condos and townhomes, 70.5 percent sold within 60 days, up from 67 percent. Homes that are priced correctly at current market conditions are selling reasonably quickly. The problem is not that listed homes are sitting; the problem is that fewer homes are being listed and fewer buyers are transacting, so the denominator of “homes that moved” has shrunk while the velocity of those that do move has improved.
The Affordability Grade and What It Reveals
An analysis published in June 2026 gave the Las Vegas housing market a C+ composite grade. Affordability received the weakest sub-grade, a C-. Property taxes received the highest, an A, reflecting Nevada’s cap on primary residence assessment increases and the absence of a state income tax.
The C- on affordability tells a specific story. Las Vegas was not an expensive market by national standards for most of its history. The pandemic-era price appreciation that pushed the median from roughly $300,000 in early 2020 to a peak of $490,000 in mid-2026 compressed the affordability window faster than wages in the Las Vegas market adjusted. Hospitality and service workers, who make up a disproportionate share of the local labor force, are earning in an economy that runs on tourism volume, and tourism volume has been declining. The premium-repositioning strategy that is working for gaming revenue is not producing proportional wage growth for the workers at the bottom half of the hospitality income distribution.
The result is a market where prices are near historical highs, rates are near post-pandemic highs, and wages for the segment of the population that forms the natural entry-level buyer pool have not kept pace with either.
Distressed Sales: Still Low, But Moving
Short sales and foreclosures made up 1.1 percent of September sales, up from 0.5 percent a year earlier. That is still near historically low levels by any absolute measure. The post-financial-crisis Las Vegas market, which was the national ground zero for foreclosures from 2008 through roughly 2013, peaked at distressed sale percentages in the 50 and 60 percent range.
The current 1.1 percent does not signal systemic distress. It signals that the rate shock that materialized over the past two years has had a mild but measurable effect on homeowners who stretched at peak prices and are now underwater or struggling with reset payments on adjustable-rate products.
The direction of travel matters more than the current level. Moving from 0.5 percent to 1.1 percent in twelve months is a doubling of the distressed sale rate, even if both numbers are small in absolute terms. If rates stay elevated through 2027, the homeowners who are current today but operating with thin margins will face a longer test of their capacity to maintain payments. The Las Vegas labor market, where preliminary August unemployment was 4.8 percent versus a national rate running below 4, provides less of a cushion than most comparable western markets.
What the Cash Buyer Data Shows
23.5 percent of September sales were all-cash, up slightly from 23 percent a year earlier. The current cash buyer share is well below the 59.5 percent peak from February 2013, when institutional buyers and investors were absorbing distressed inventory in bulk.
The current cash buyers are a different demographic: a combination of retirees relocating from higher-cost states, investors making smaller portfolio additions rather than bulk purchases, and buyers who have accumulated equity from property sales in California or the Pacific Northwest and are deploying it into a market they believe is underpriced relative to its long-term trajectory.
Nevada’s no-income-tax status continues to attract relocating buyers from California, where the combined state and local income tax burden for high earners is among the highest in the country. That migration flow has been a structural support for Las Vegas housing demand for twenty years and has not materially reversed even as prices have risen and rate costs have increased. The buyers this migration produces tend to be higher-income and more likely to be cash buyers or significant down payment buyers, which insulates the top of the market from rate sensitivity more than the middle and lower segments.
The Forecast Nobody Will Make
National home price indices project modest appreciation or flat prices for 2027 in most of their Las Vegas scenarios, contingent on rates stabilizing in the 6.5 to 7.5 percent range. Applied Analysis, the Las Vegas-based economic firm that tracks the market most closely, has generally aligned with the view that the Las Vegas market is in a consolidation period rather than a decline, supported by the continued population growth the metro has experienced and the long-term supply constraint created by developable land limitations and construction costs.
What no credible analyst is forecasting is a return to the 2024 appreciation pace that pushed prices from the low $400s to $490,000 in under two years. That pace was anomalous even by Las Vegas standards. The current environment, characterized by stable-but-elevated prices, compressed volume, rising inventory, and a buyer pool constrained by rates, is more likely to produce a slow grind sideways than either a sharp correction or a renewed acceleration.
For buyers who need to transact, the five months of supply and the improving 60-day sale rate suggest a market with real negotiating room compared to the peak. For sellers who bought near that peak and need to exit, the math is harder, particularly if they bought with a small down payment in the $480,000-to-$490,000 range and are now pricing into a $460,000-to-$470,000 comparable market while carrying a 7 percent mortgage they cannot cheaply retire.
The Las Vegas housing market in October 2026 is not in crisis. It is in that particular kind of stasis that precedes clarity in one direction or the other, waiting on the one variable that is genuinely outside anyone’s control.
Key Insights
The divergence between Las Vegas’s 6.6 percent year-over-year inventory increase and its 7.4 percent decline in single-family sales volume creates a supply-demand balance that should theoretically produce meaningful price softening, but the cash buyer cohort, which at 23.5 percent of sales represents a segment entirely insulated from mortgage rate effects, is absorbing enough of the available inventory to maintain price stability near the peak even as financed buyer demand contracts.
Las Vegas’s 4.8 percent preliminary unemployment rate against a sub-4 percent national average represents a structural labor market vulnerability that standard housing market analyses tend to underweight because the hospitality concentration of the local workforce means any tourism demand shock translates directly into income volatility for the homeowner cohort most exposed to rate sensitivity.
The doubling of the distressed sale rate from 0.5 to 1.1 percent over twelve months, while still near historically low absolute levels, is the leading indicator most worth tracking in the next two to four quarters because it reflects the homeowners who stretched at peak prices beginning to exhaust their capacity to sustain payments, and the trajectory of that number in a sustained elevated-rate environment will determine whether Las Vegas experiences a soft landing or a more meaningful correction in 2027.
The California migration inflow that has been a structural demand floor for Las Vegas housing for two decades is continuing to provide support at the top of the market through cash buyer activity, but it cannot compensate for the entry-level demand destruction caused by rates above 7 percent because the California relocator pool, while large, is insufficient to absorb a market that historically turns over 30,000 to 40,000 residential units per year.
Sources
FOX5 Vegas: Las Vegas Realtors Report Fewer Homes Selling
Nevada Real Estate Group: Las Vegas Housing Market Report Card 2026
Nevada Real Estate Group: Las Vegas Housing Market 2026
Norada Real Estate: Las Vegas Real Estate Market
UNLV Lee Business School: In the News